Yesterday McGuffin/Sock were blown out in the first round of the PPA event in North Carolina. Here is what the “Added Value” analysis looks like:
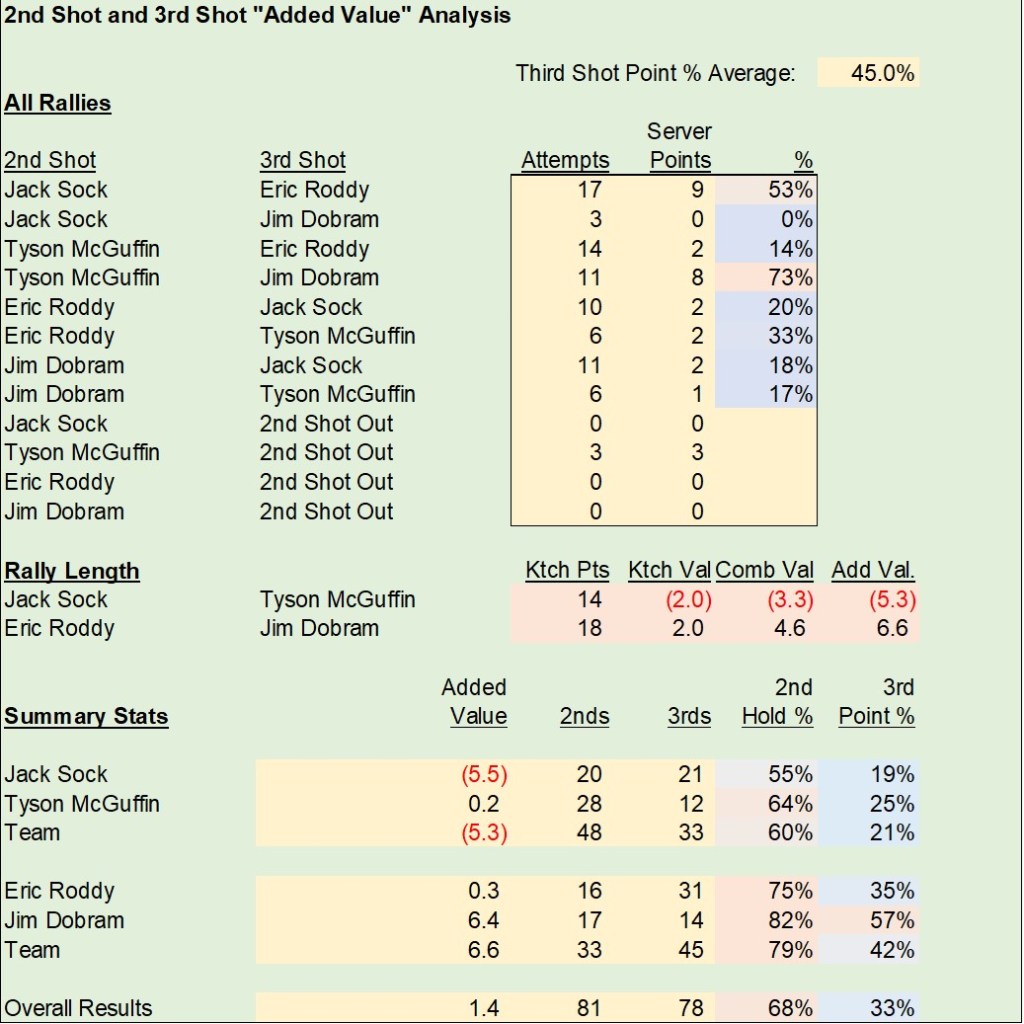
We see that Jack Sock was at -5.5 points of added value … while Jim Dobram was at +6.4 points of added value. This was ultimately the difference. McGuffin stuffing three returns of serve into the dumpster didn’t help matters. Sock’s team only scored 19% of the time when Sock attempted a third shot … well below the 40% – 45% average we see in typical PPA matches.
Look at the top portion of the table. In terms of 2nd/3rd shot combinations, McGuffin returned 11 serves to Dobram, and when that happened Dobram’s team scored a point 73% of the time. This was a big part of the formula for Roddy/Dobram’s win. Dobram’s play was key … when he returned the serve his team held 82% of the time … when he hit the third shot his team scored 57% of the time.
Roddy/Dobram would lose their next two matches … sometimes odd things happen in pickleball!
