The Johns brothers played yet another Championship Match against Newman/Wright on Sunday, winning in four games.
In this match, I charted the team that won the point based on rally length. Here are the results.
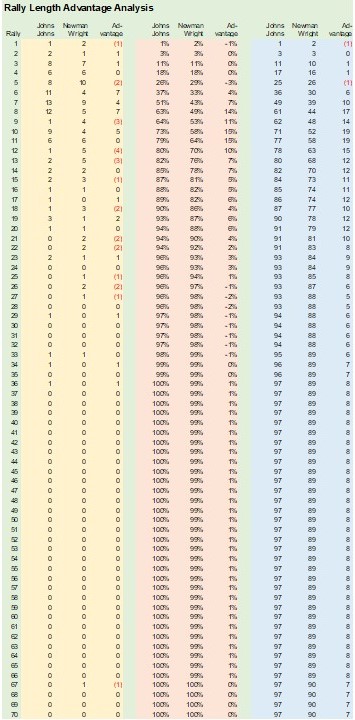
On the far left side of the chart, we see rally length (1 to 70).
The yellow section tabulates how many times each team won after a rally of “x” shots.
The salmon section measures the cumulative percentage of wins for each team by rally length. For example, Johns/Johns won 79% of their points on or before eleven (11) shot attempts, whereas Newman/Wright won 78% of their points on or before fourteen (14) shot attempts.
The blue section cumms winning points by shot attempt. In the match, Johns/Johns won 97 total points, Newman/Wright won 90 total points.
Ok, you’ve had a chance to view the data. Where did Johns/Johns control this match?
Well, the outscored Newman/Wright 46-26 on rallies that lasted 6-10 shots. Short rallies (1-5 shots) were 26-25 in favor of Newman/Wright … long rallies lasting 11+ shots were 38-26 in favor of Newman/Wright.
When Ben Johns controlled points on the fifth shot and beyond, Johns/Johns performed well. If Newman/Wright could outlast the onslaught from Ben Johns, they controlled points thereafter.
In my analyses, the players controlling the “middle” of points (typically 5th shots through about 12th shots) tend to win matches. This finding may change as I analyze more matches, but that’s what I’ve observed over the past few months.
