The chart below is for the first game in the APP Sacramento event held over the weekend, charting Hayden Patriquin and Wyatt Stone’s 3rd shot attempts. The chart shows Drive (D) and Drop (P) attempts, red coloring means they lost the point, green coloring means they won the point.
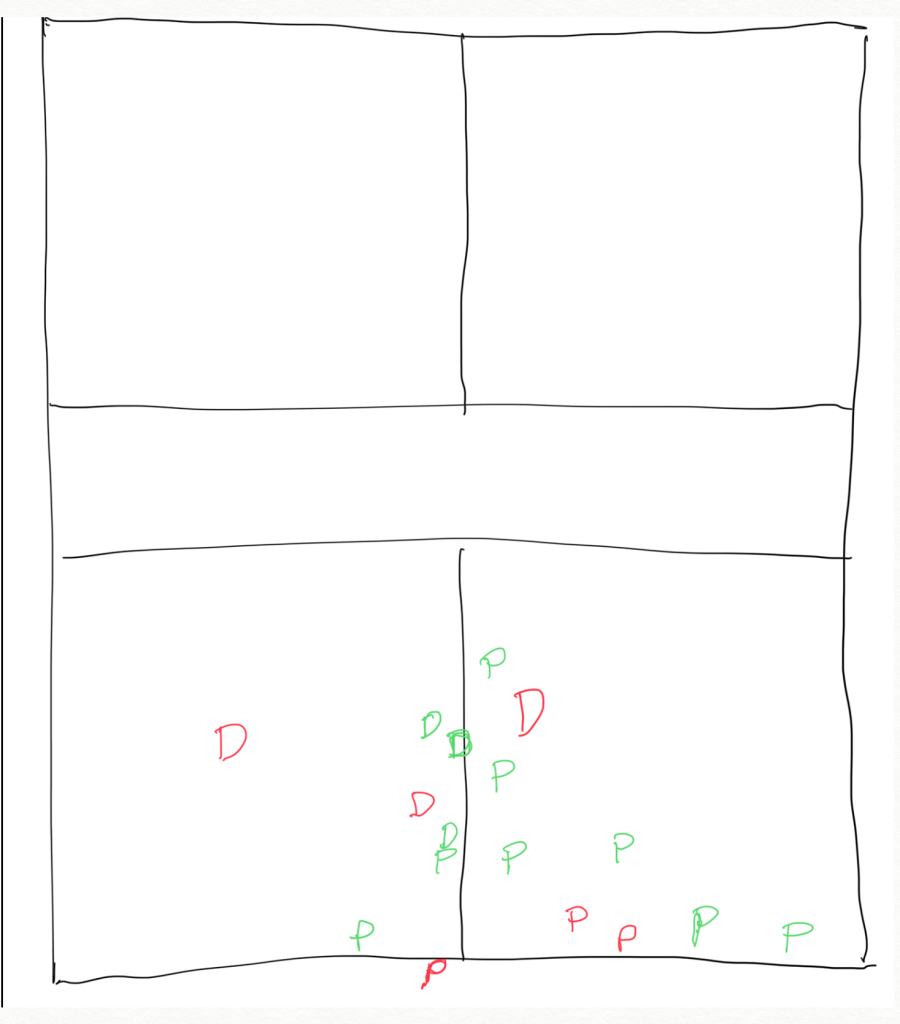
Notice where the drives happen – they’re pretty disciplined, hitting drives in the middle of the court (middle depth, along the center line). Drops are hit back near the baseline.
Drive Success = 3 of 6, 50%.
Drop Success = 8 of 11, 73%.
Drop Success at the Baseline = 3 of 6, 50%.
Drop Success in front of the Baseline = 5 of 5, 100%.
Rip those mid-depth / center returns of serve.
Notice that drop success increased as they got away from the baseline … we’d expect this to be the case.
